Turn the stocks you own into a monthly paycheck.
Cash Flow Machine teaches a conservative, rules-based covered call method for generating reliable income from your portfolio — like collecting rent from stocks, without the tenants. Learn it from Mark Yegge, a former Wall Street CEO who has traded over $14 billion, with step-by-step mentorship and the CashFlowIQ platform at your side.
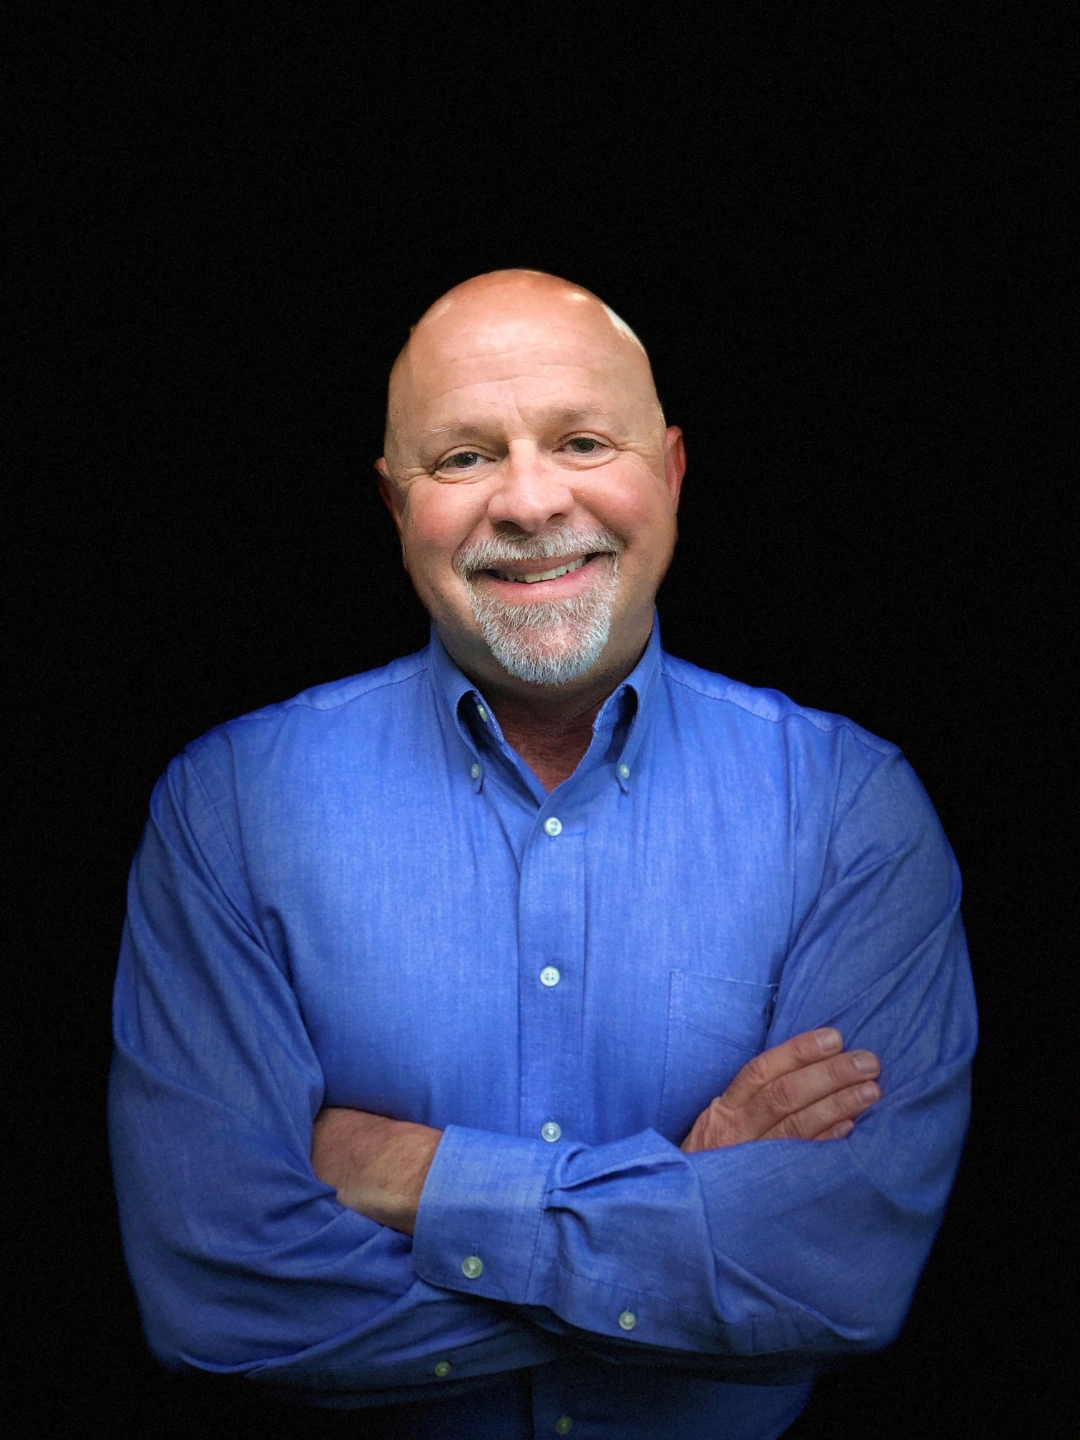
*Individual results, not typical. Figures reflect Mark Yegge's own trading and member targets; they are not a promise of future performance. Options trading involves risk, including possible loss of principal.
"Buy and hold and hope" is no way to fund a retirement.
You did the responsible thing — you saved and invested. But the standard Wall Street advice quietly works against you:
- In 2022 the stock market fell about 24% and the bond market has declined more than 50% since — "diversified" didn't protect you.
- Fees on typical managed advice average around 3.41% per year, skimmed right off the top of your money.
- You're told to expect "average" returns and just wait — with no income coming in while you wait.
- Most options buyers (about 80%) lose money, so "trading options" feels like gambling.
The fear underneath it all is simple: running out of money, or never having enough coming in to feel free.
What if your portfolio paid you — every month?
There's a reason the pros don't just buy and hope. As sellers of covered calls, you're on the winning side of the same options trade that most buyers lose on. Instead of betting on certainties (there are none in the market), the Cash Flow Machine system plays probabilities — inching your odds from a coin-flip toward 77%+ in your favor.
- Generate cash flow of roughly 2–4% per month from stocks you already own*
- Conservative by design — most members target just 1–2% per week*
- A repeatable, rules-based plan instead of hot tips and emotion
- Only ~20 minutes to an hour a week to implement

The method, tested with real money.
In early 2020, someone challenged Mark to prove the Cash Flow Machine could make 50% in a year. He took his Schwab IRA and — trading only Netflix and Tesla with the method — grew it from $111K to over $700K.
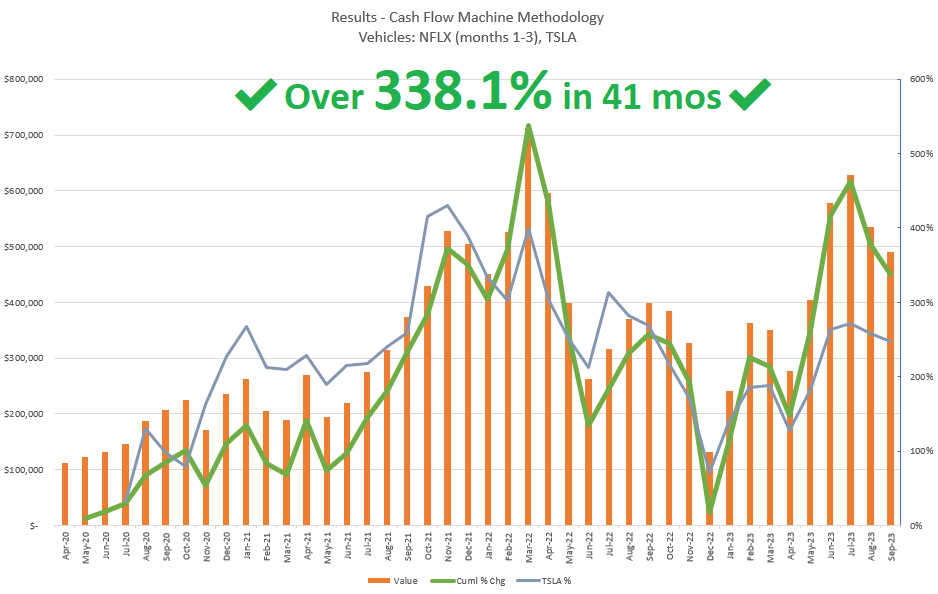
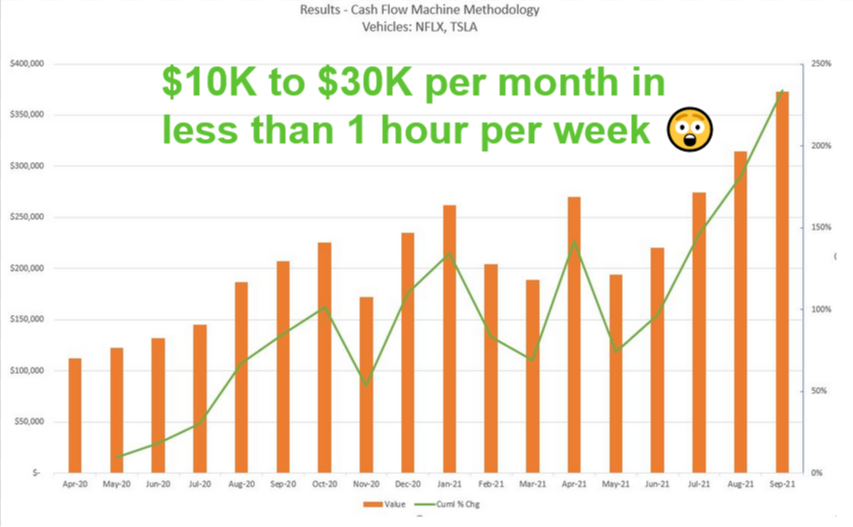
*Individual results, not typical, and not a guarantee of future performance. These reflect Mark Yegge's own documented trading. Investing and options trading involve risk, including the possible loss of principal.
Knowledge. Mindset. Tools.
Knowledge alone won't make you a trader — or we'd all read a golf book and become Tiger Woods. The Cash Flow Machine gives you all three.
Learn the system
The complete, step-by-step covered call method — reading the market, choosing the right stocks and strikes, and collecting "the juice."
Trade without emotion
Mindset is 90% of trading. A written trading plan guides your decisions so fear and greed don't — the way professionals do it.
Implement with CashFlowIQ
Plan, pressure-test and review every trade with the AI-assisted CashFlowIQ platform, plus mentorship when you have a question.
Prefer to explore first? Try CashFlowIQ free for 14 days — no card required.

Mark Yegge has been where you are.
A former Wall Street CEO, trader and hedge-fund manager, Mark has traded over $14 billion in securities across more than four decades. He started trading at 12 and bought his first car — a cherry-red Camaro — at 16.
Inspired by the legendary Edward Thorp, he's spent his life refining a covered call system that creates reliable income in any market, and teaching it to thousands of investors. He's the author of The Cash Flow Machine, host of the Wealth Architect Podcast, and the voice behind the @coveredcalls channel.
"My goal is to get you making $10K, $20K, or $30K+ each month." — Mark Yegge*
Real people. Real income. Real confidence.
A few of the thousands who've learned to build their own cash flow machine.
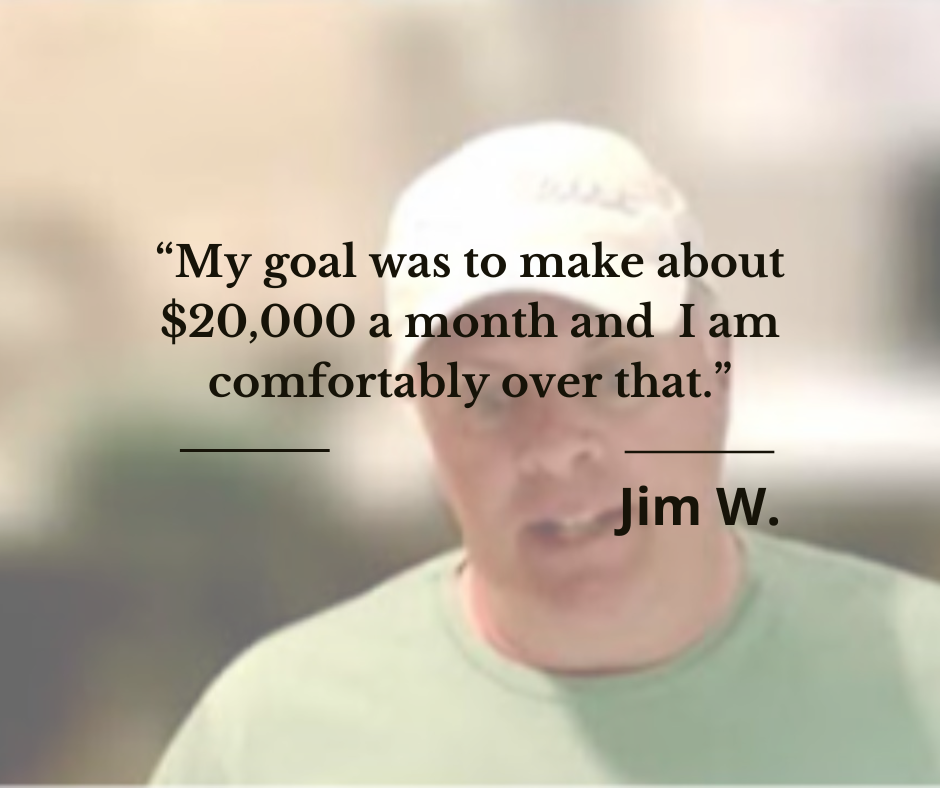
I'm up 53.6% for the year right now, and there's still 3 weeks to go. Yeah — it's great!DKDavid K.Cash Flow Machine member
Mark gives you a method. I went from a lot of stress to feeling incredibly confident and comfortable — and it can be fun and quite rewarding financially.LALee A.Mentorship member
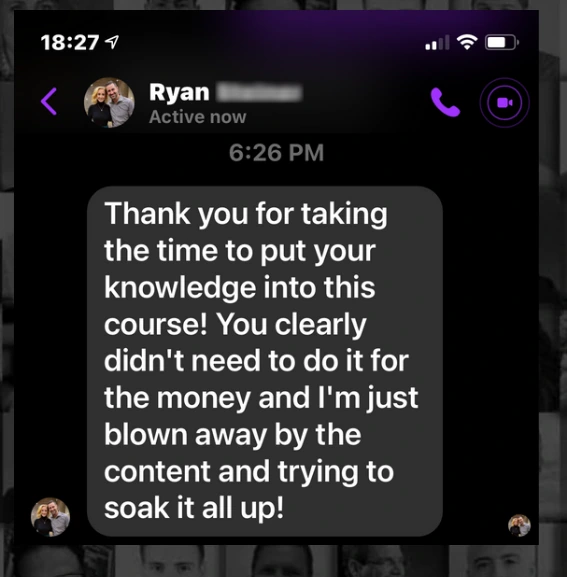
I have never felt so relaxed during a market meltdown. CFM is an incredible strategy. Life changing. Thank you, Mark.MKMike K.Cash Flow Machine member
I am very happy with this course and the confidence it has given me — and the money that I have earned.COChris O.Cash Flow Machine member
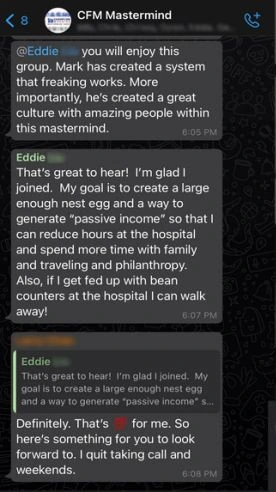
Already started trading and made more than the course cost in two weeks.MOMoisesCash Flow Machine member
This has all blown my mind.RBRichard B.Elite student
Individual results, not typical, and not a guarantee of future performance. Testimonials are from real members; some last names are abbreviated for privacy.
Start free. Learn the method. Get mentored.
Most people start by trying the platform free, then step into the course and mentorship when they're ready to go all in.
CashFlowIQ Free Trial
Free
14 days · no credit card required
- Full access to the AI platform
- Plan, test & review your trades
- Your own stocks and plans
Options Mentorship
Apply
Individual & group mentorship with Mark's team
- The complete covered call system
- Live mentorship & trade feedback
- Real-time trade alerts & community
Elite + CashFlowIQ
$3,995
Lifetime Elite Course + CashFlowIQ
- The full Elite curriculum, for life
- CashFlowIQ and the AI Coach
- Learn at your own pace
See the system in action — free.
CashFlowIQ is the AI-assisted platform built on the Cash Flow Machine method. Bring your own stocks and see how it feels to plan, pressure-test and review a covered call trade with a coach in your corner.
- Full access to every tool for 14 days
- No credit card to start
- Keep going, or step up to the mentorship anytime
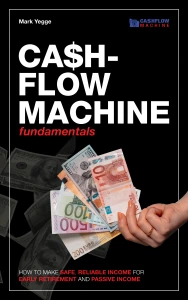
Free covered call guides.
New to the strategy? Start with these in-depth guides from the Cash Flow Machine team.
Covered call income, answered.
What is a covered call?
A covered call is an options income strategy where you sell a call option on stock you already own. You collect a premium (income) in exchange for agreeing to sell your shares at a set price if the stock rises above it. It's one of the most conservative ways to generate monthly income from a stock portfolio.
How much income can covered calls generate?
It depends on the stocks, the market, and how conservatively you trade. Cash Flow Machine members typically target roughly 1–2% per week, or about 2–4% per month — though results vary and are not guaranteed. Options trading involves risk, including the possible loss of principal.
Do I need experience to start?
No. The system is designed for both beginners and experienced investors. It teaches the method step by step, and most members implement it in about 20 minutes to an hour per week.
Who is Mark Yegge?
Mark Yegge is the creator of the Cash Flow Machine covered call system — a former Wall Street CEO, trader and hedge-fund manager who has traded over $14 billion in securities during a career spanning more than 40 years, and the author of The Cash Flow Machine.
What is CashFlowIQ?
CashFlowIQ is the AI-assisted platform built on the Cash Flow Machine system. It helps you plan, pressure-test and review covered call trades. You can start a free 14-day trial with no credit card required.
How do I get started?
The fastest way is to try CashFlowIQ free. When you're ready to learn the full method with guidance, explore the mentorship.
Your money should work as hard as you did to earn it.
Learn the covered call system that's helped thousands turn their portfolios into monthly income. Start today — right where you are.
Already a member? Sign in